01
Data collection and analytics
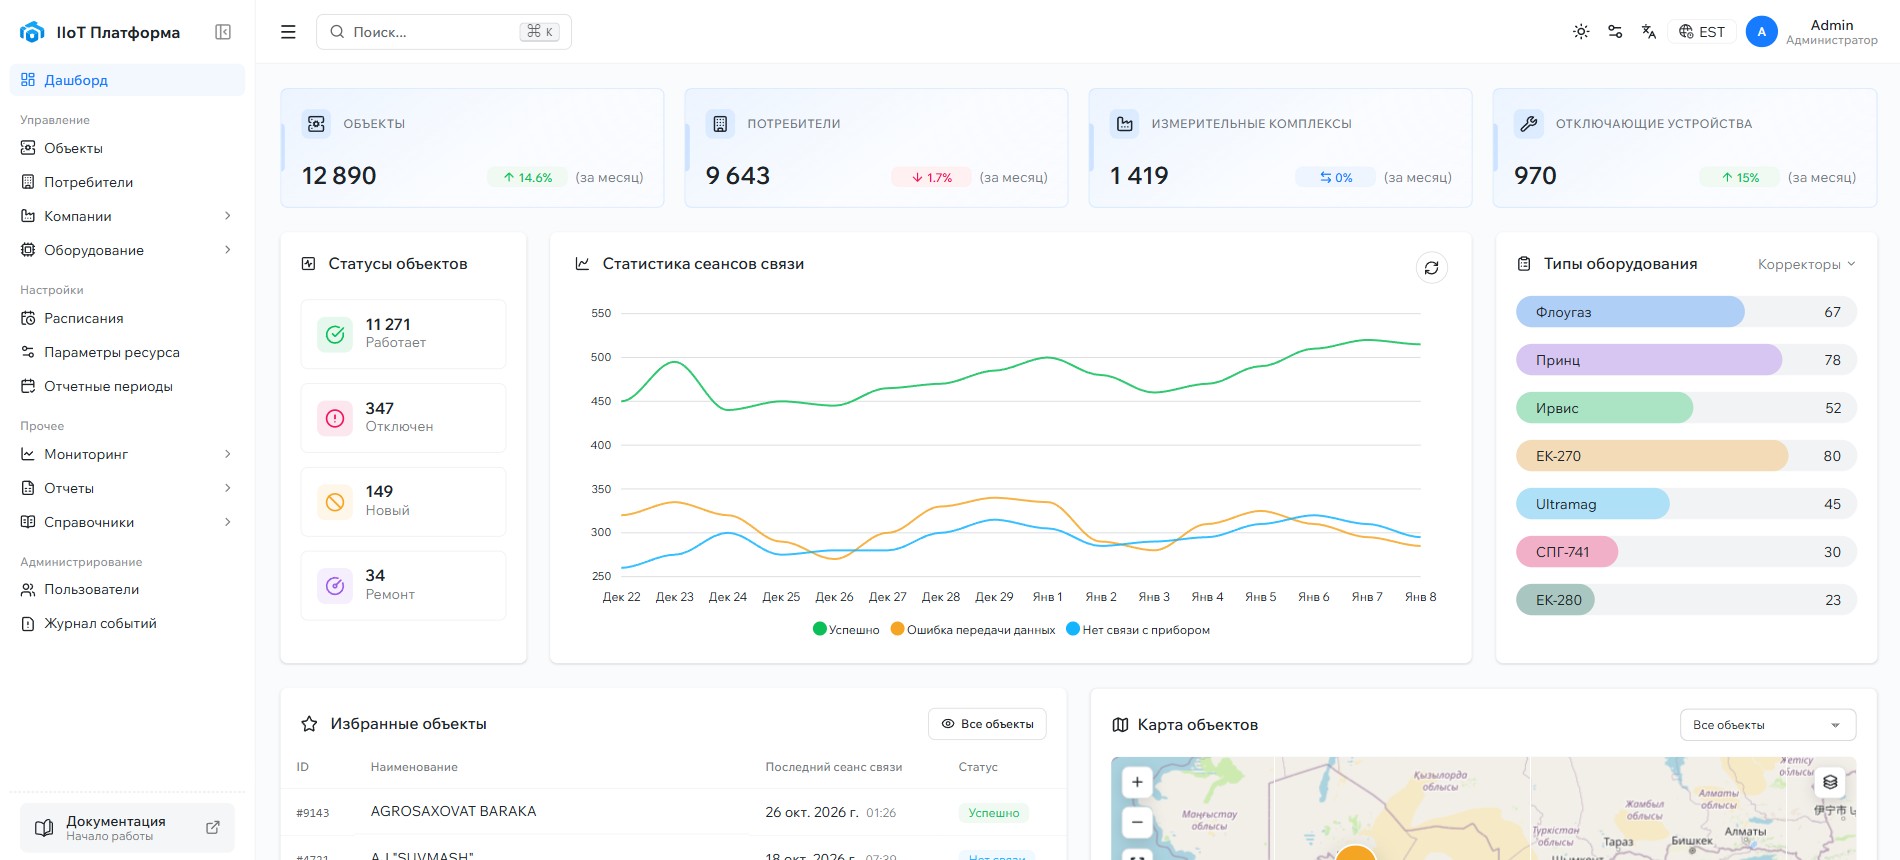
Scheduled and on-demand meter polling, validation, hourly and daily archives, predictive analytics — all on a shared data model.
DashboardSitesConsumersCompaniesSchedulesArchives
Open module/collect
Nine subsystems on a shared core — from polling gas, water, heat and electricity meters to SCADA dispatching, operational tasks, document workflow and a fault-tolerant cluster. One data model, one access perimeter, one interface.
Scheduled and on-demand meter polling, validation, hourly and daily archives, predictive analytics — all on a shared data model.
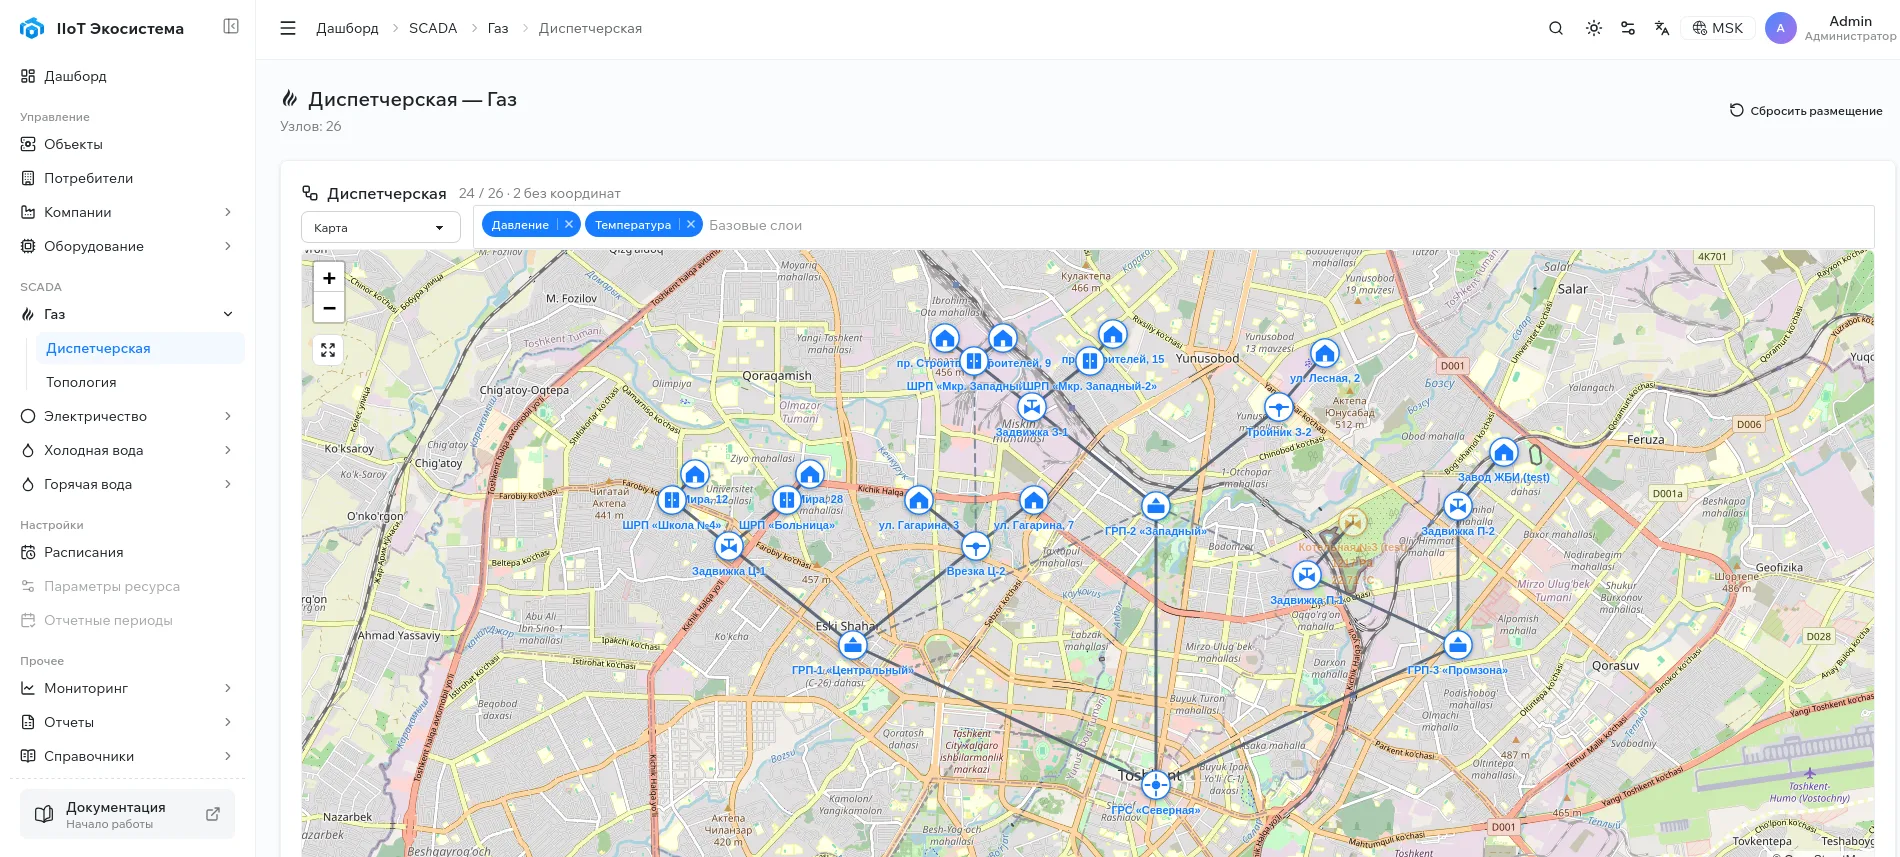
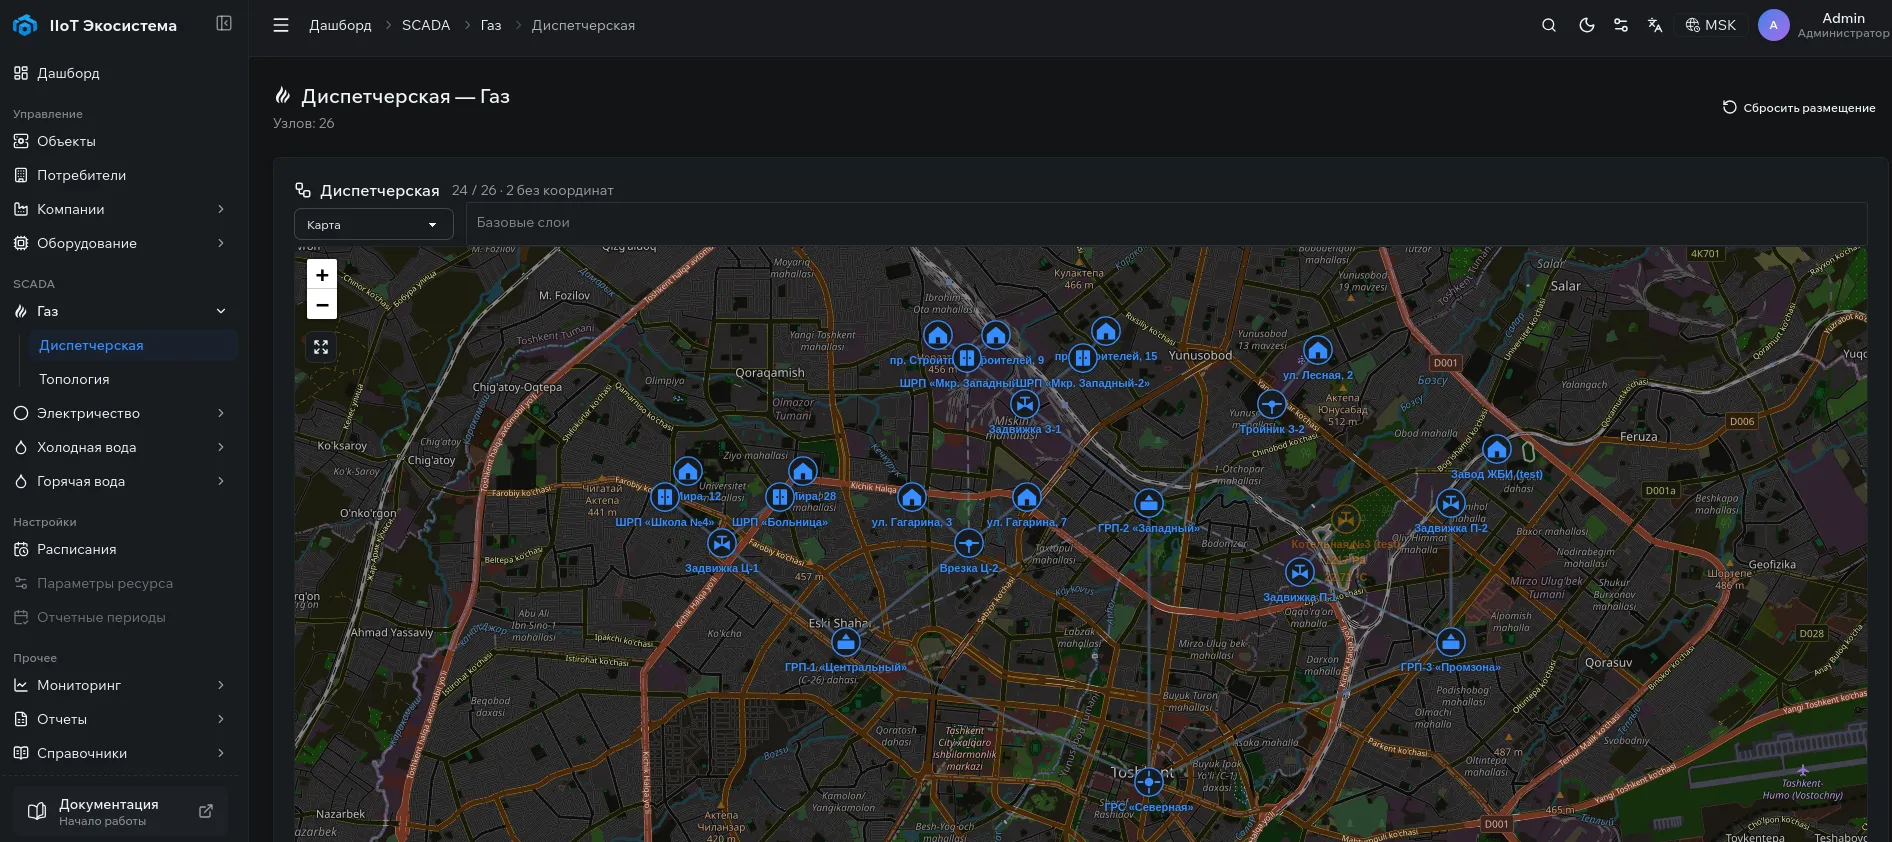
A network map with gas distribution stations, regulation points and valves, site mimic diagrams and telemetry layers on top — the dispatcher workplace.
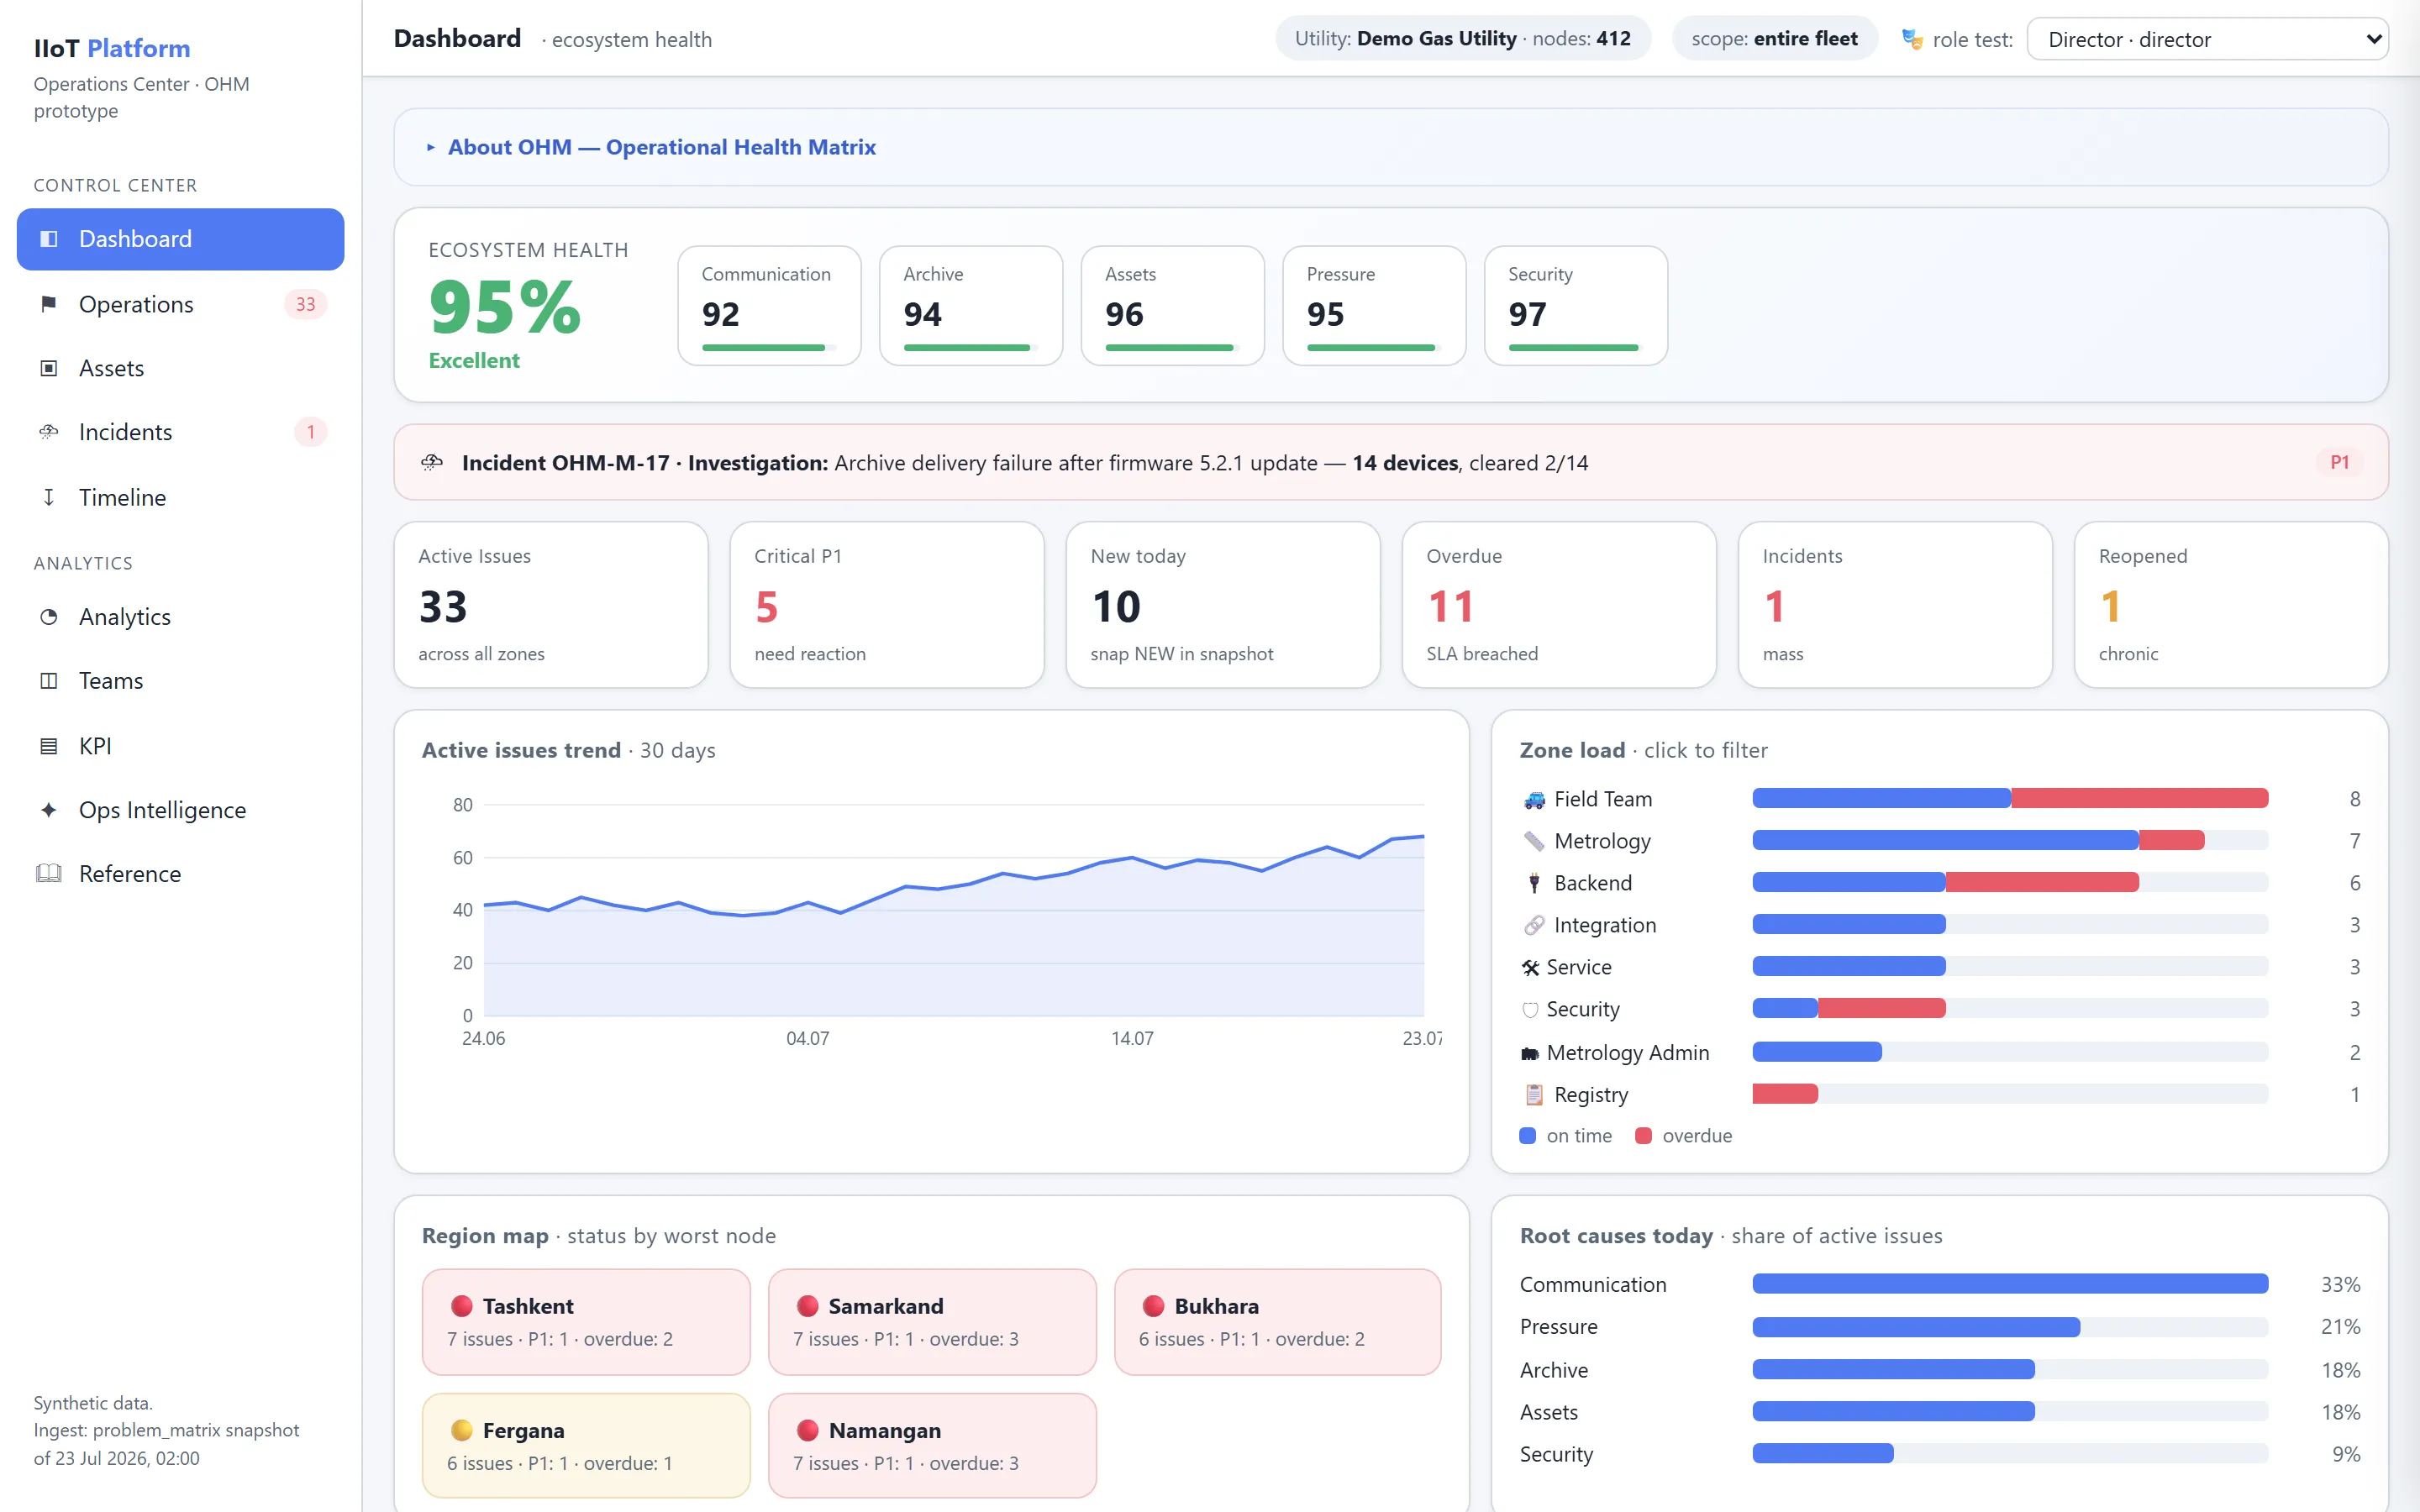
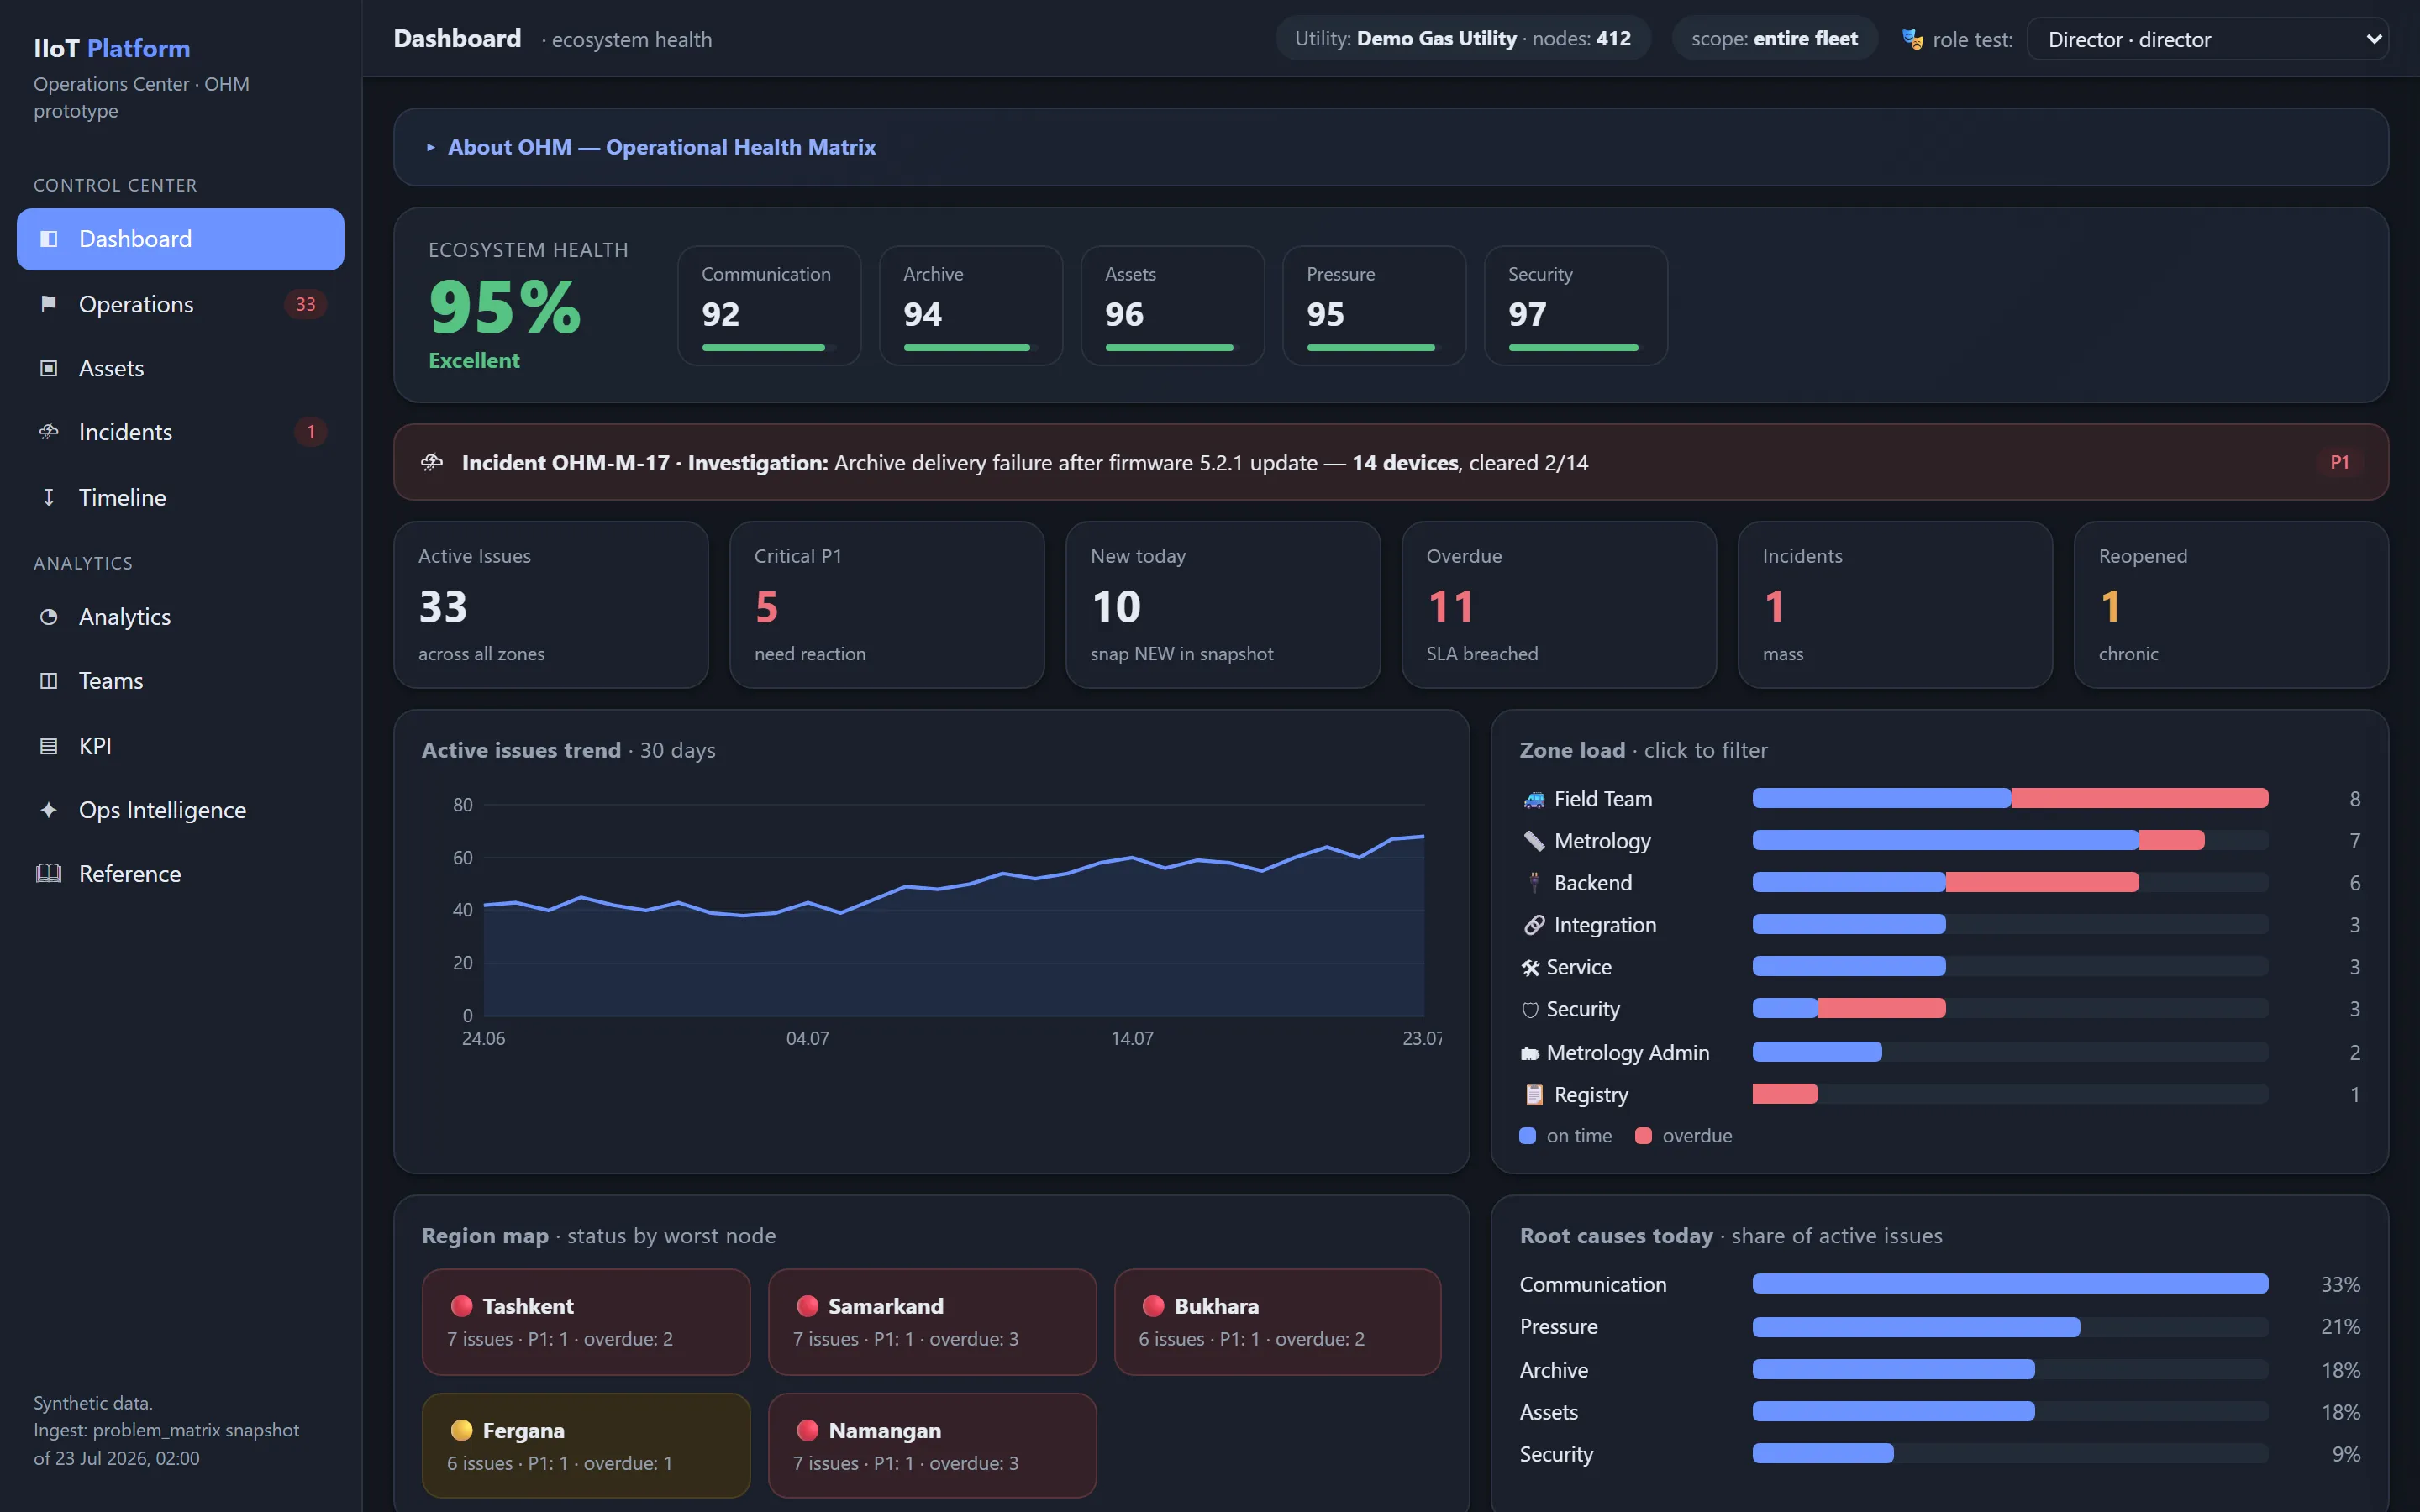
Detection of technical, metrological and integration problems, an owner and an SLA for every task, closure with automatic verification against fresh data.
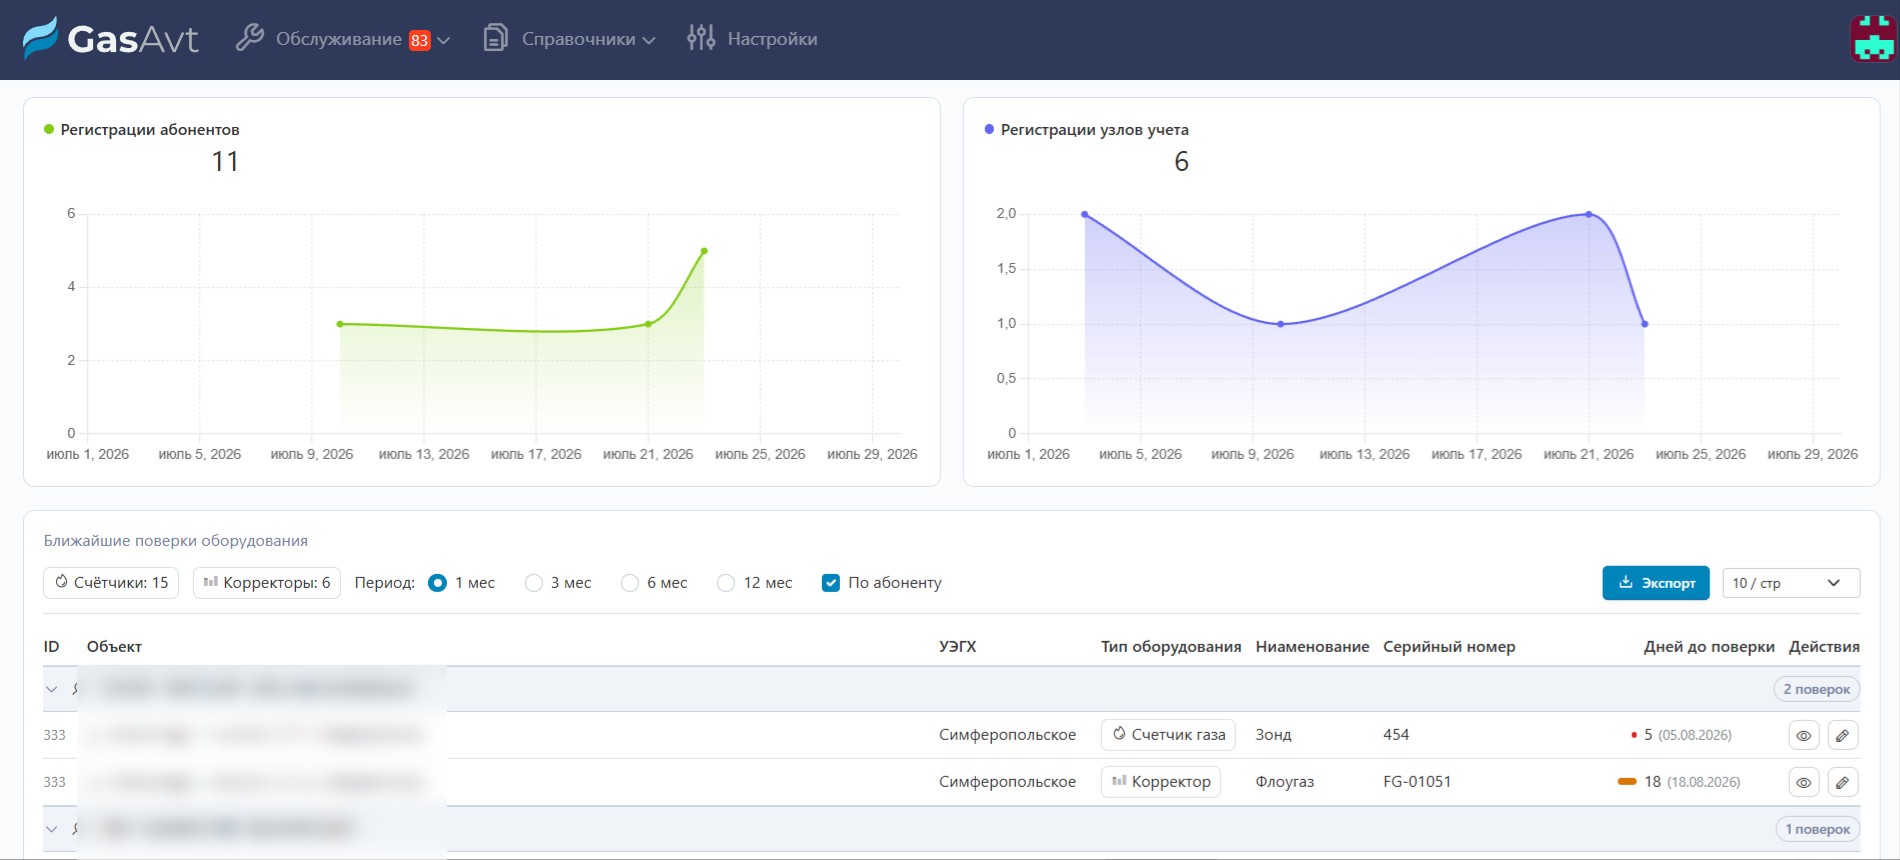
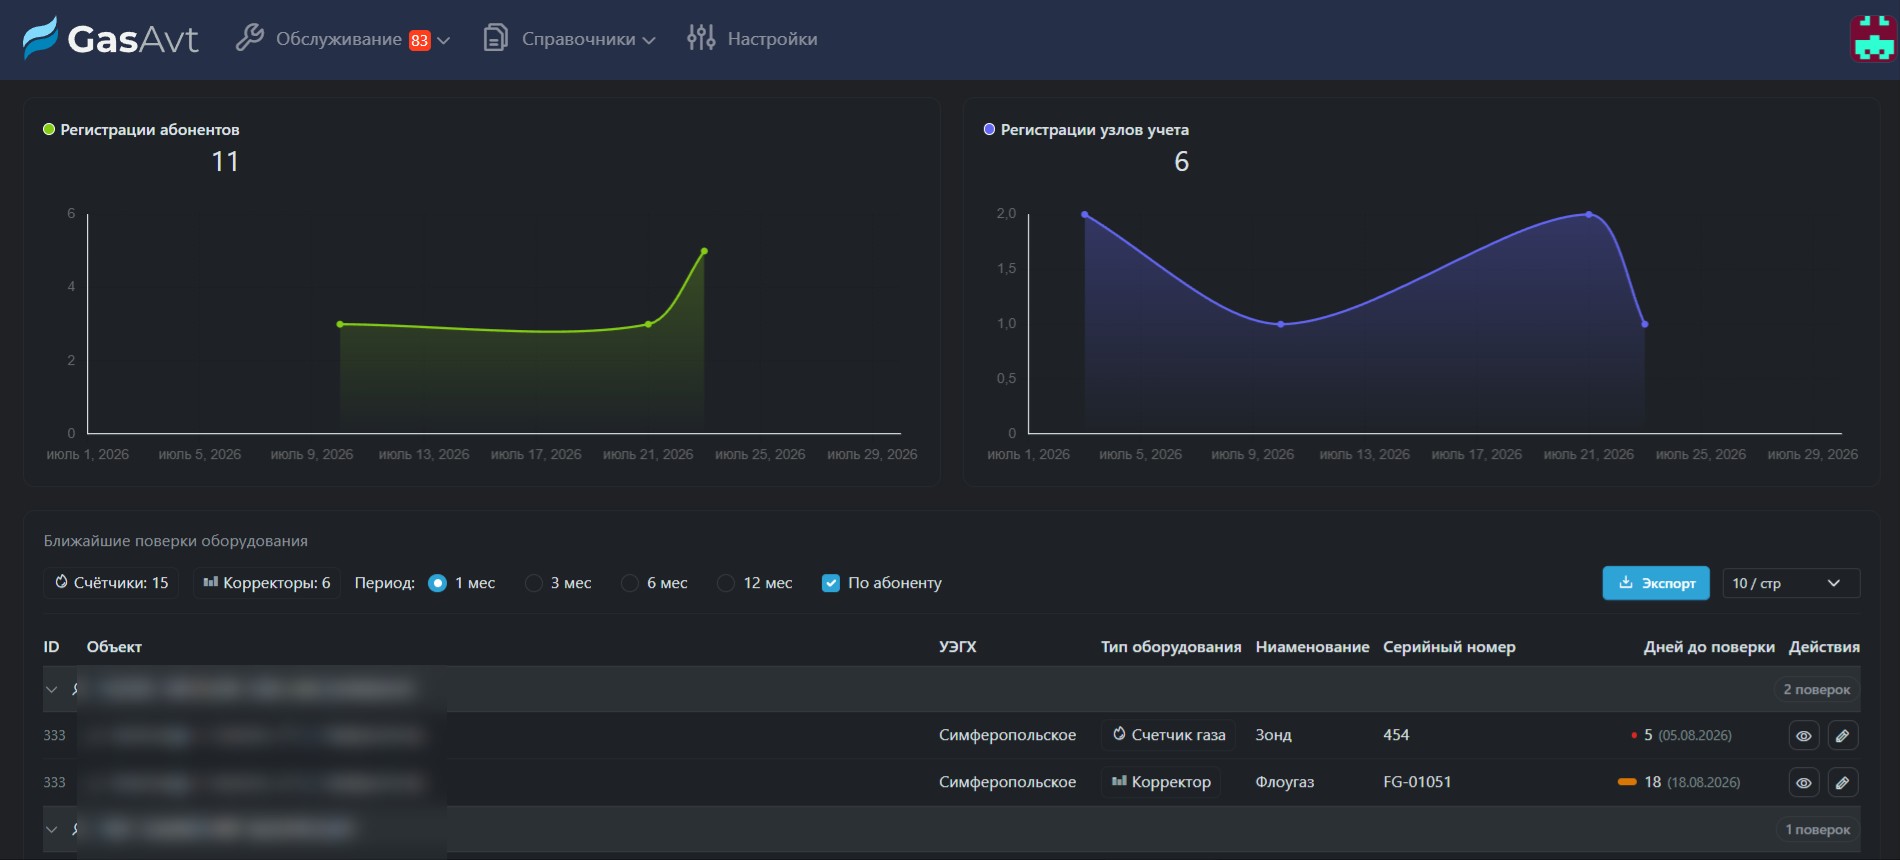
Routine work and maintenance planning, requests and work orders for field crews, control over verifications and replacements — with full history per metering point.
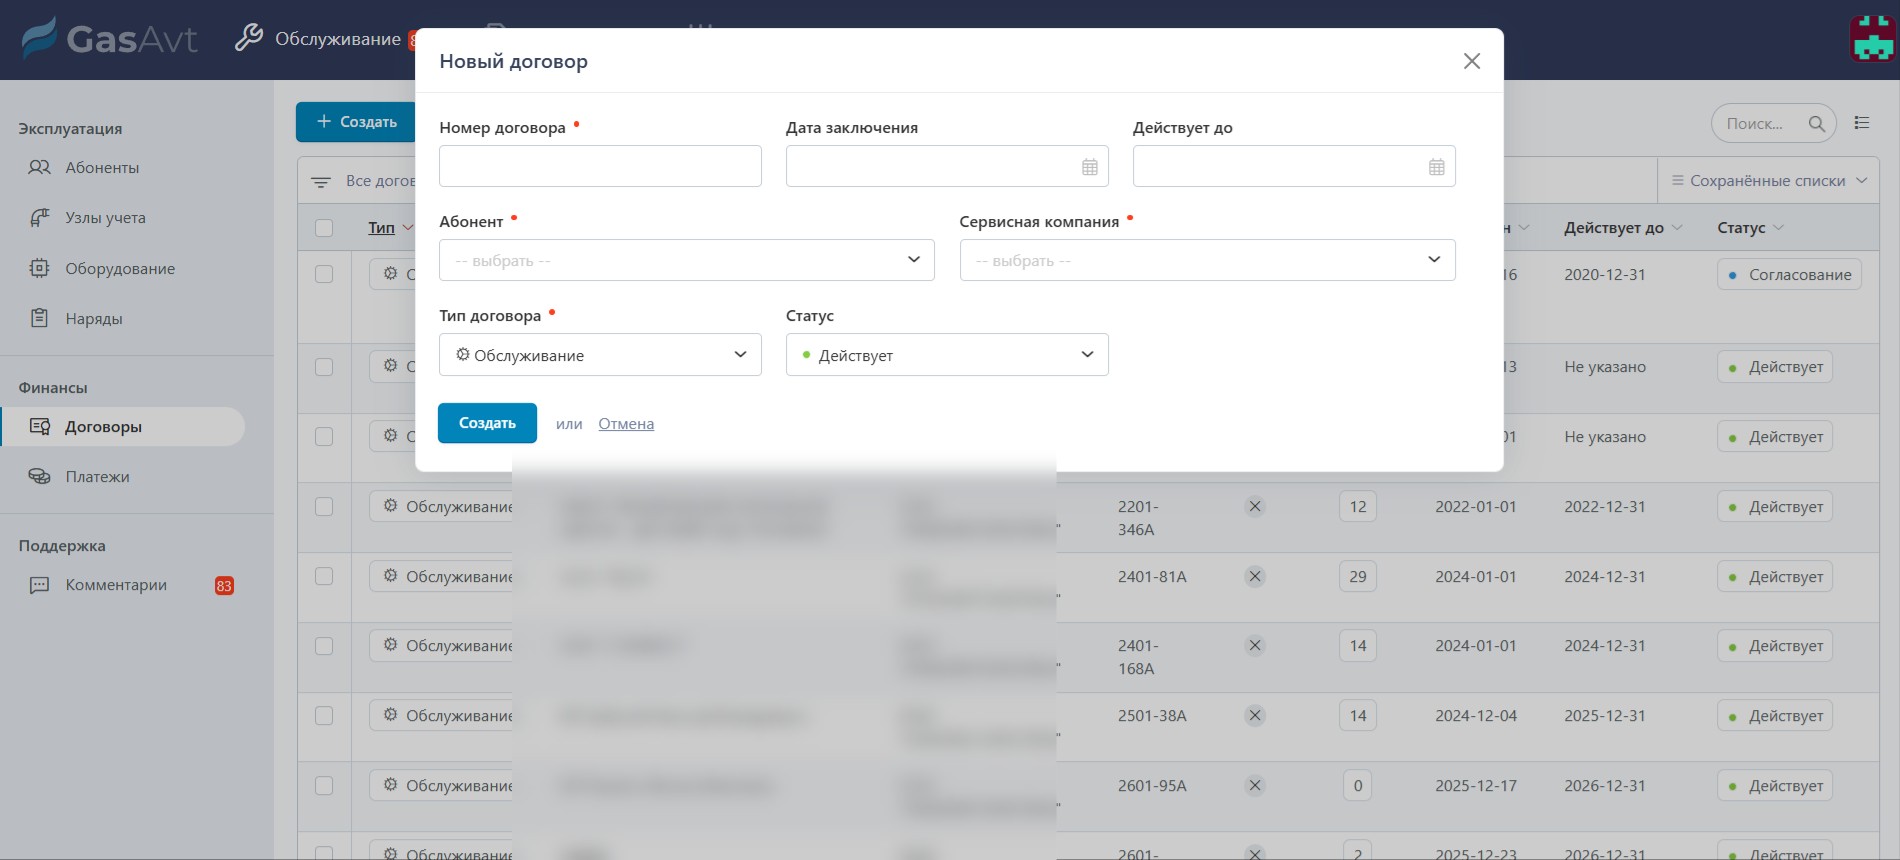
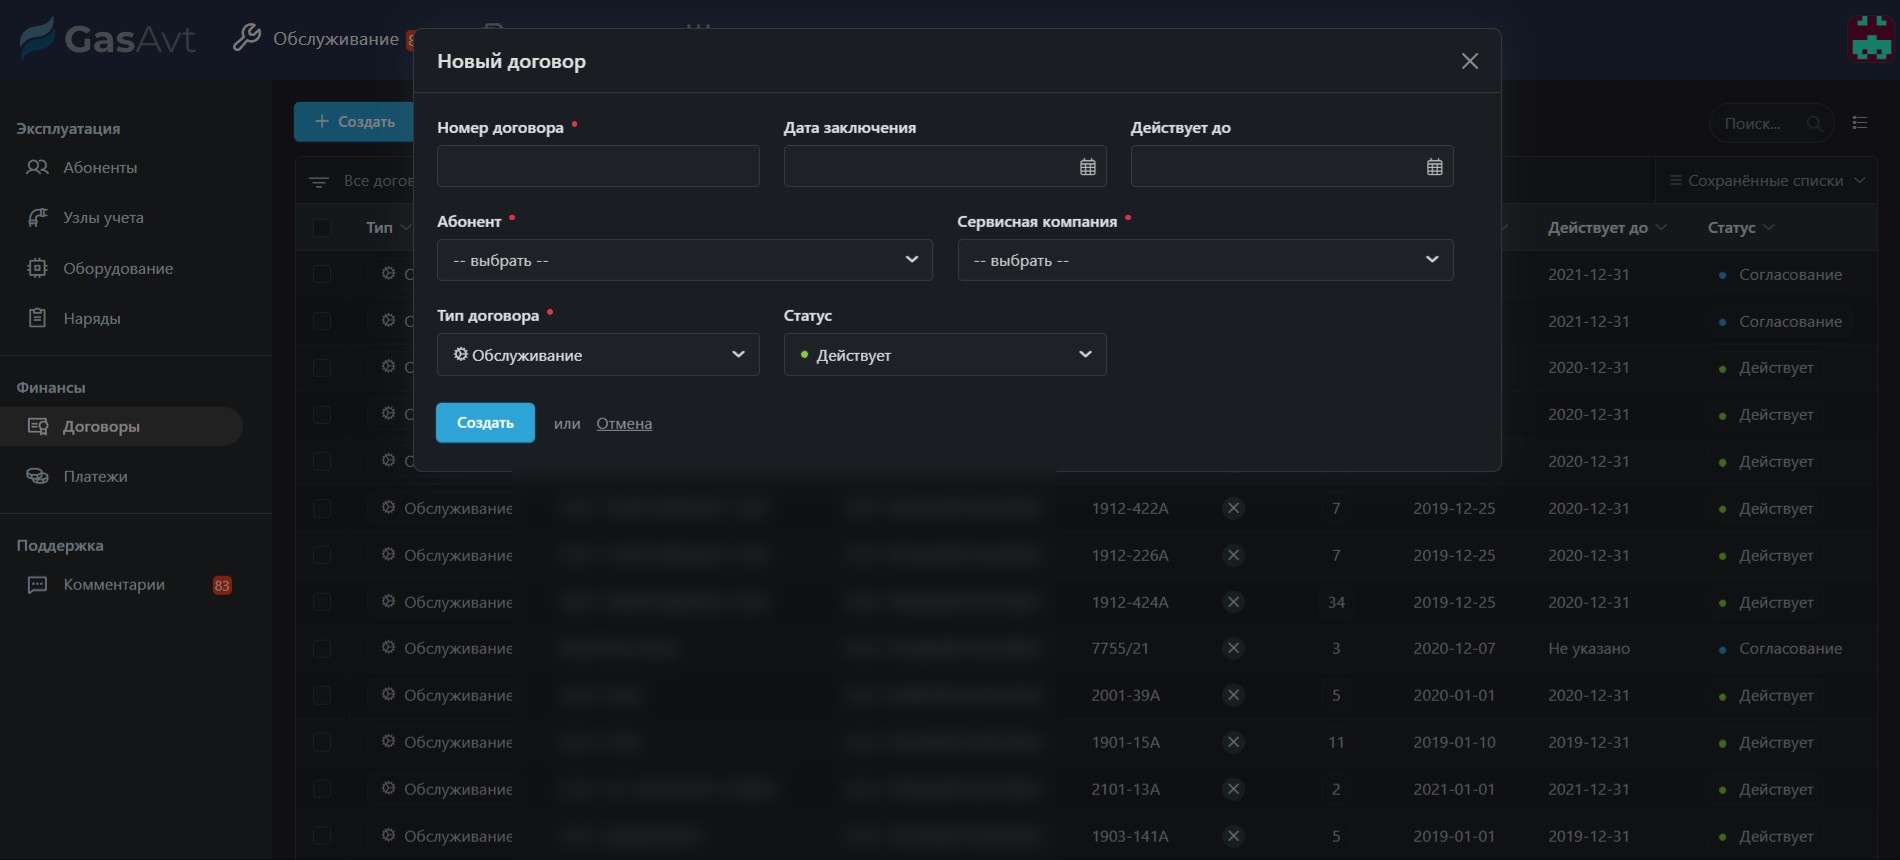
Counterparty relations: contracts, acts and supporting documents kept next to the metering site they belong to.
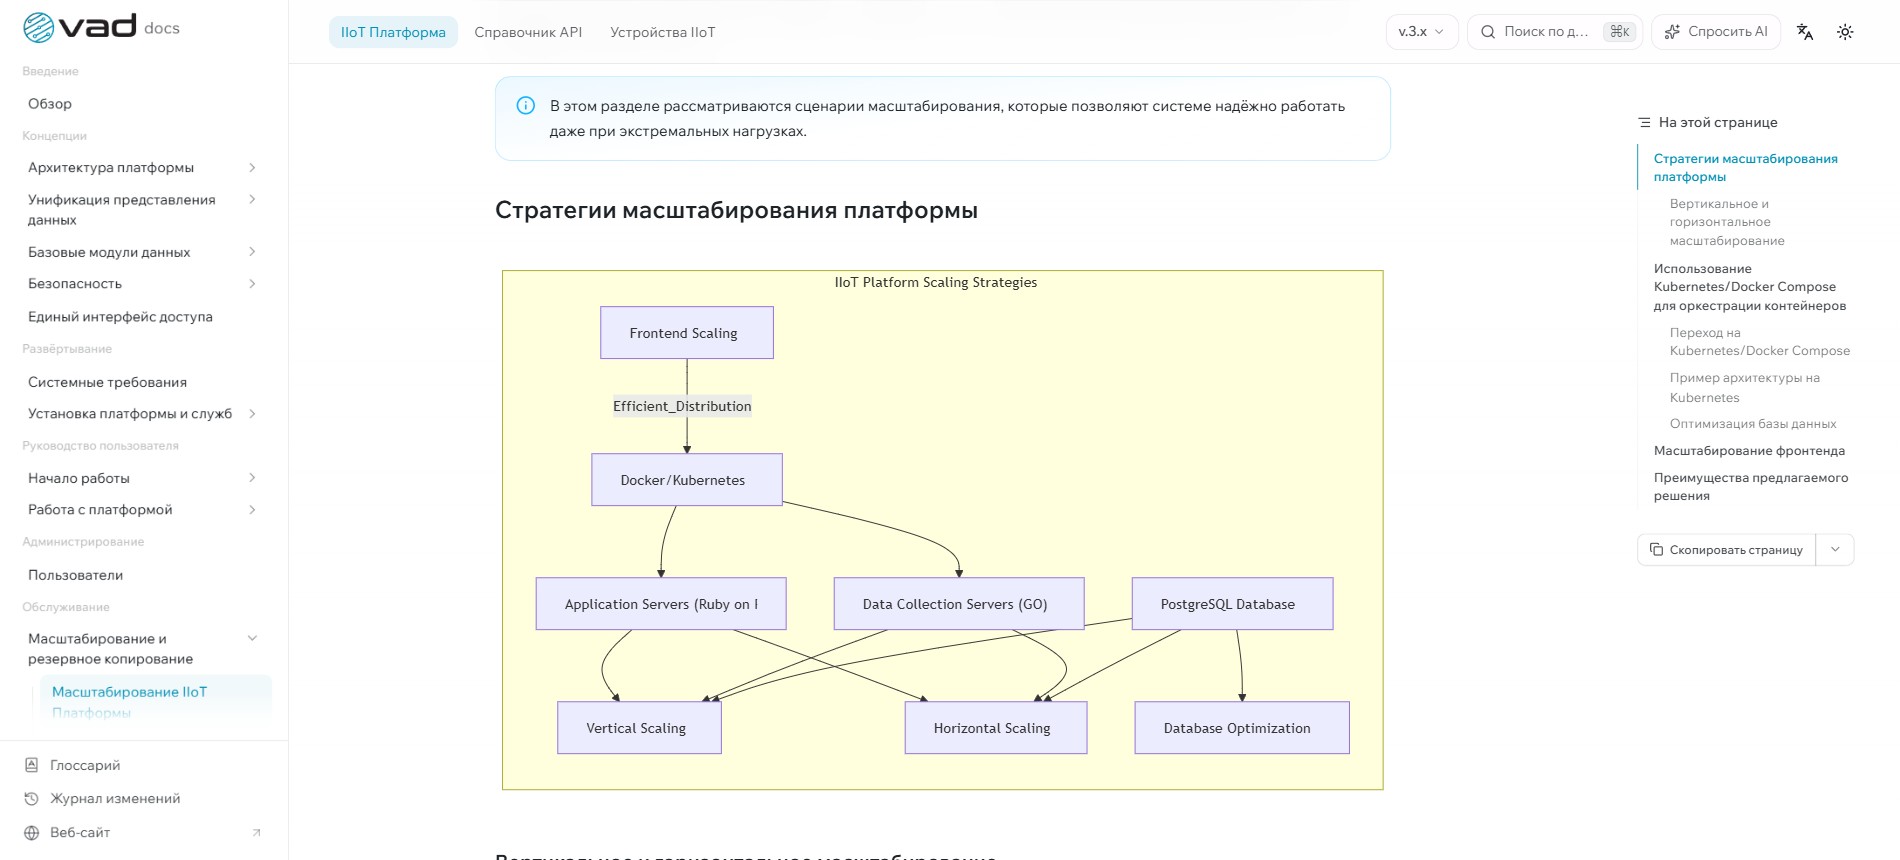
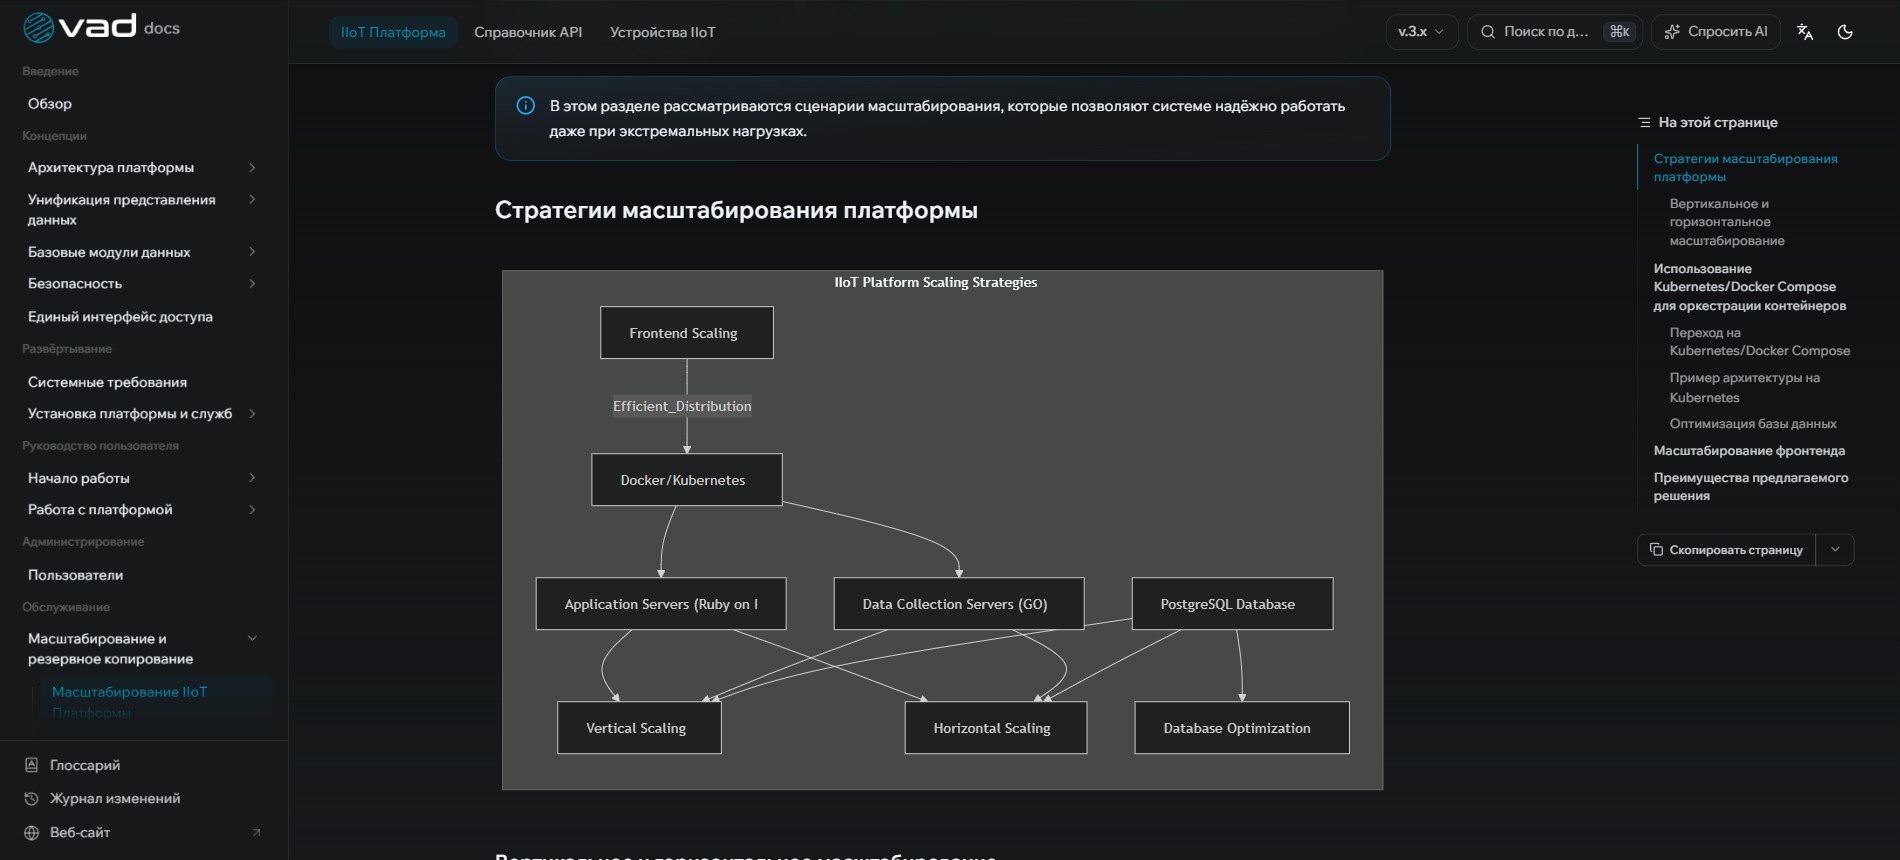
Horizontal scaling, service redundancy and data replication: meter polling and equipment control continue when a node fails.
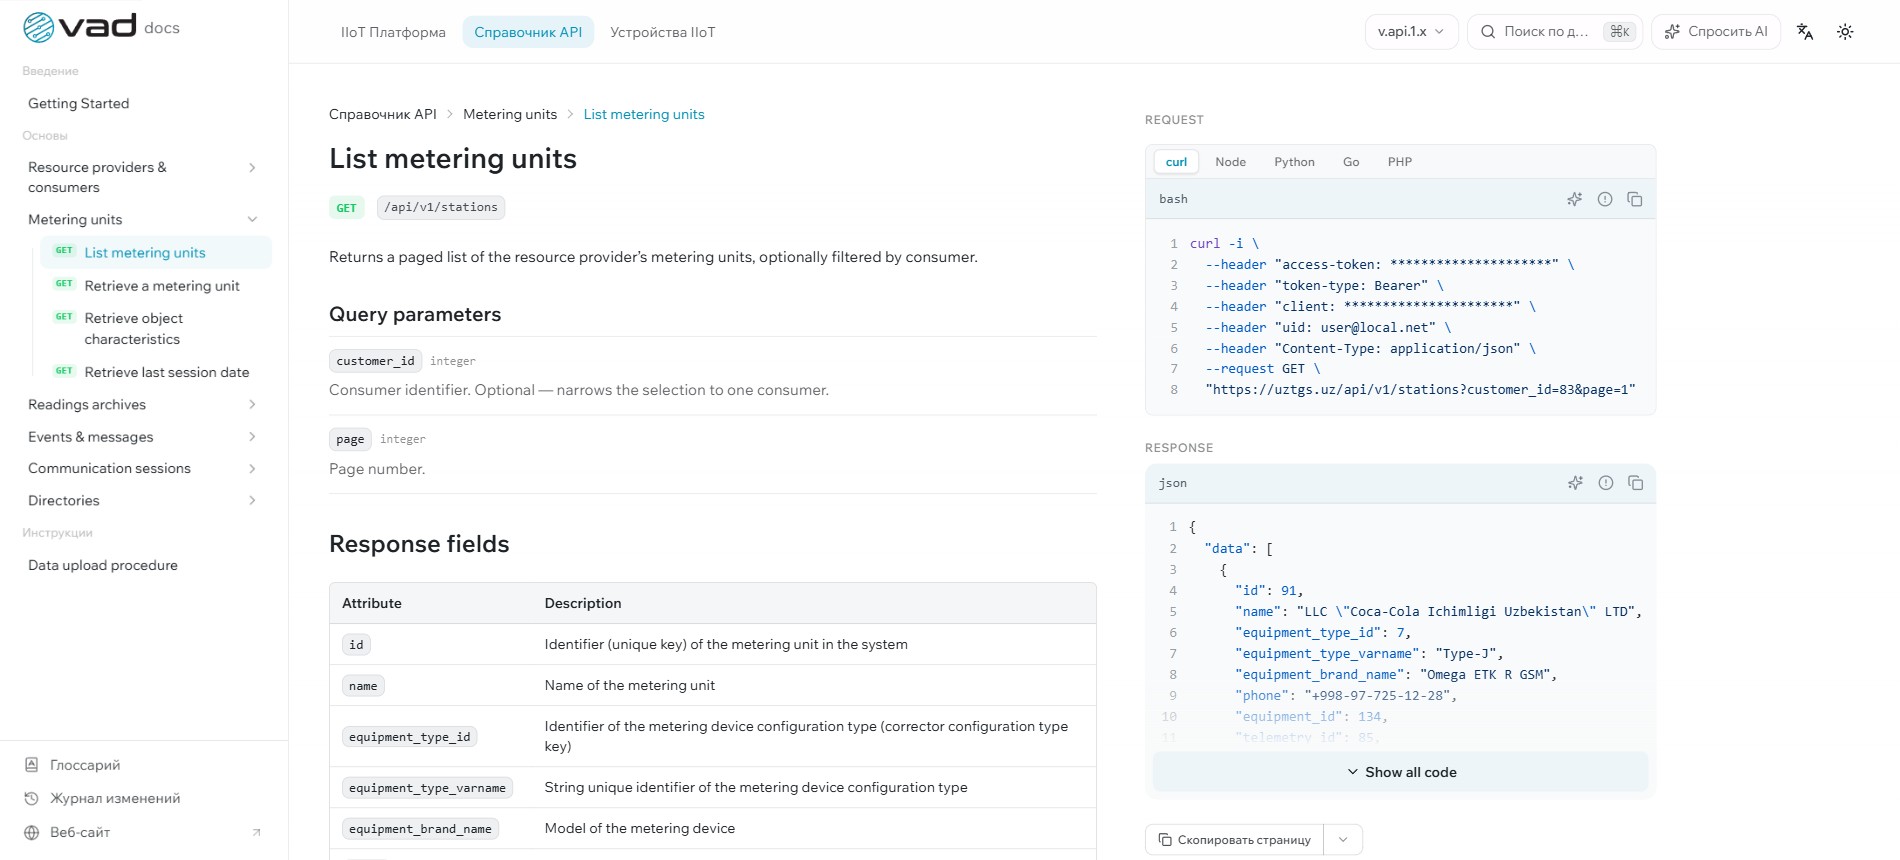
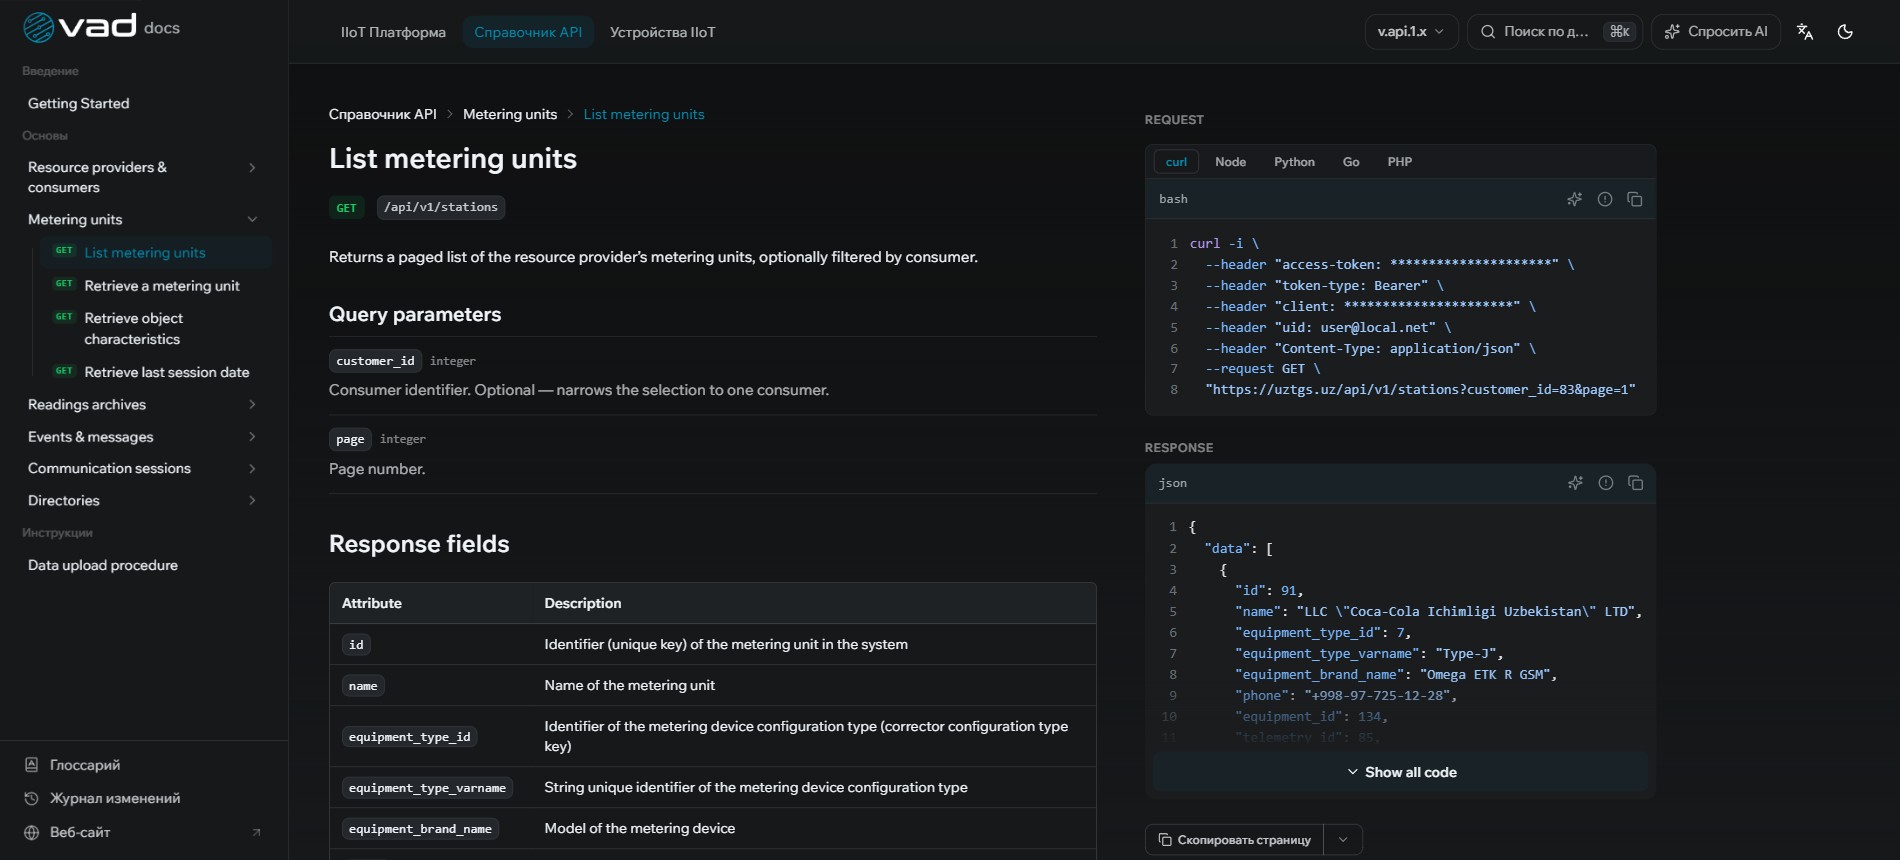
REST API and open data contracts: readings, states and platform events are available to the customer’s accounting and dispatching systems.
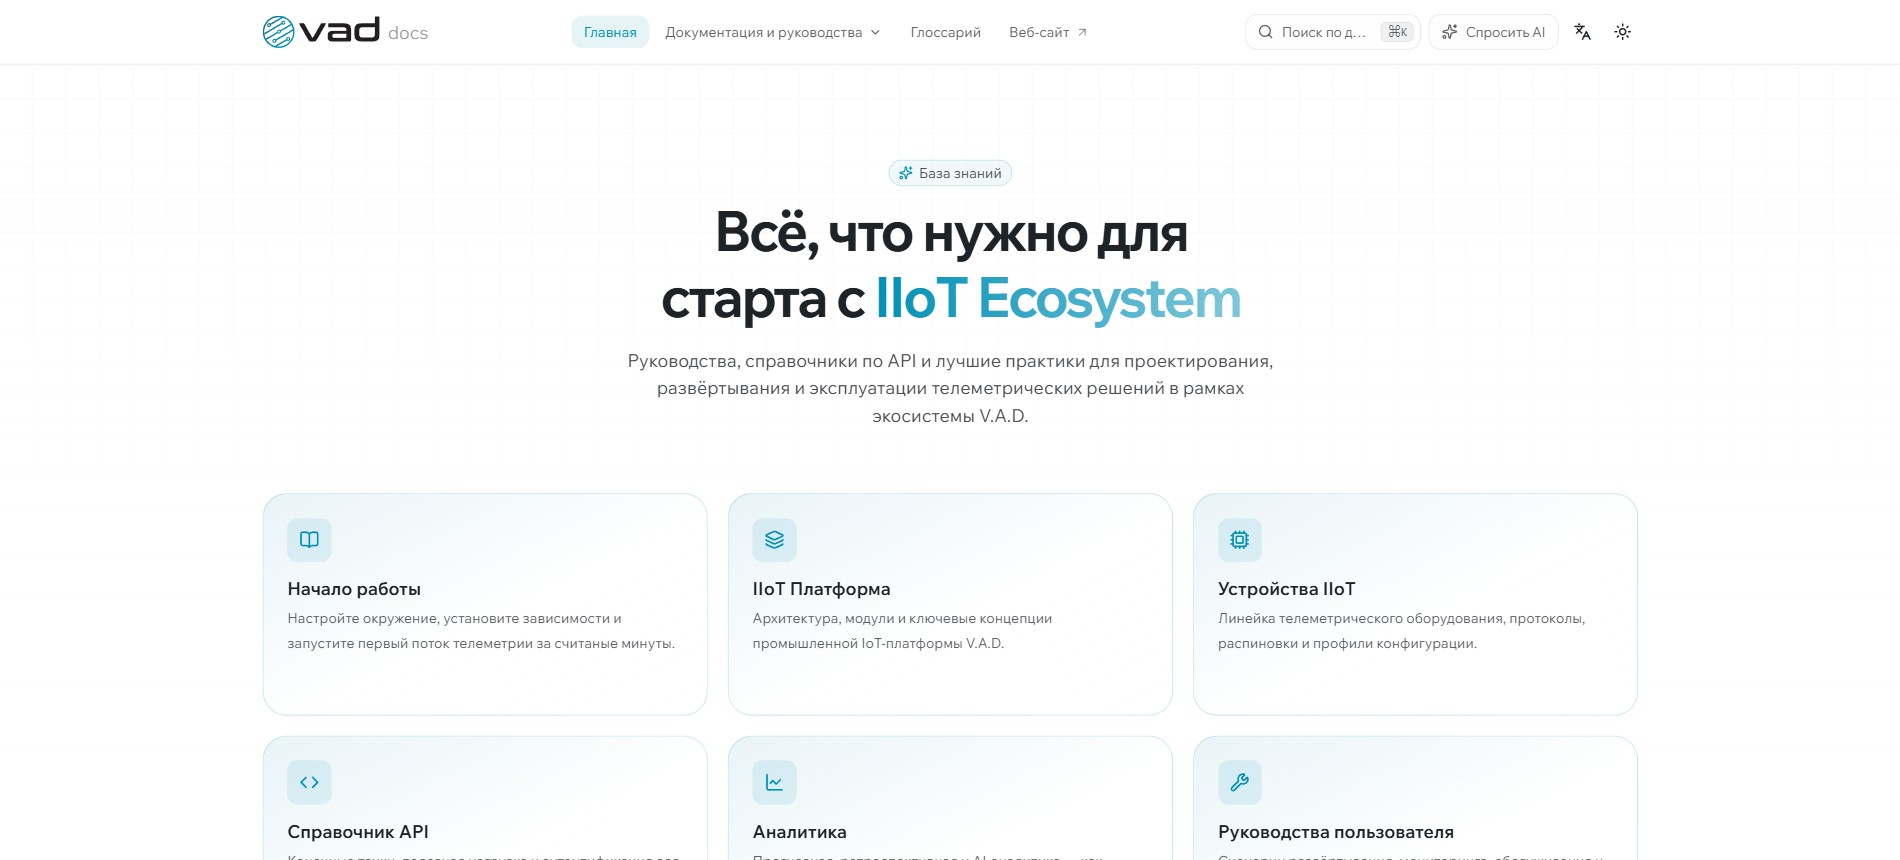
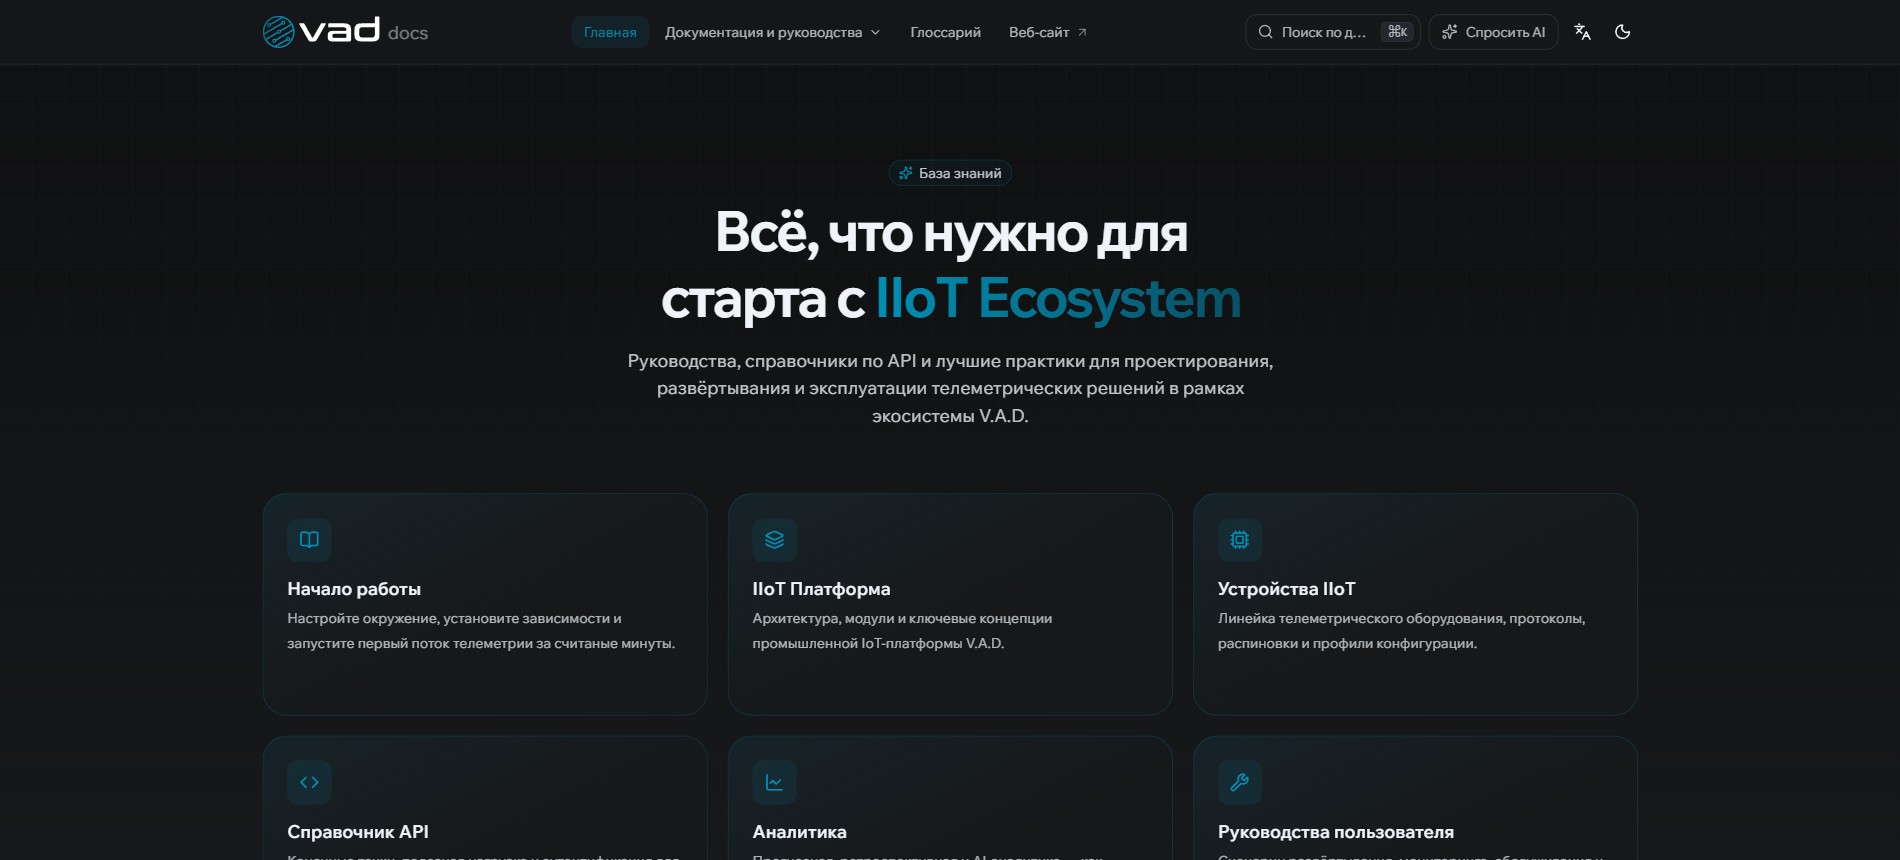
Architecture, installation, guides for every subsystem and an API reference — in one ecosystem style and in several languages.
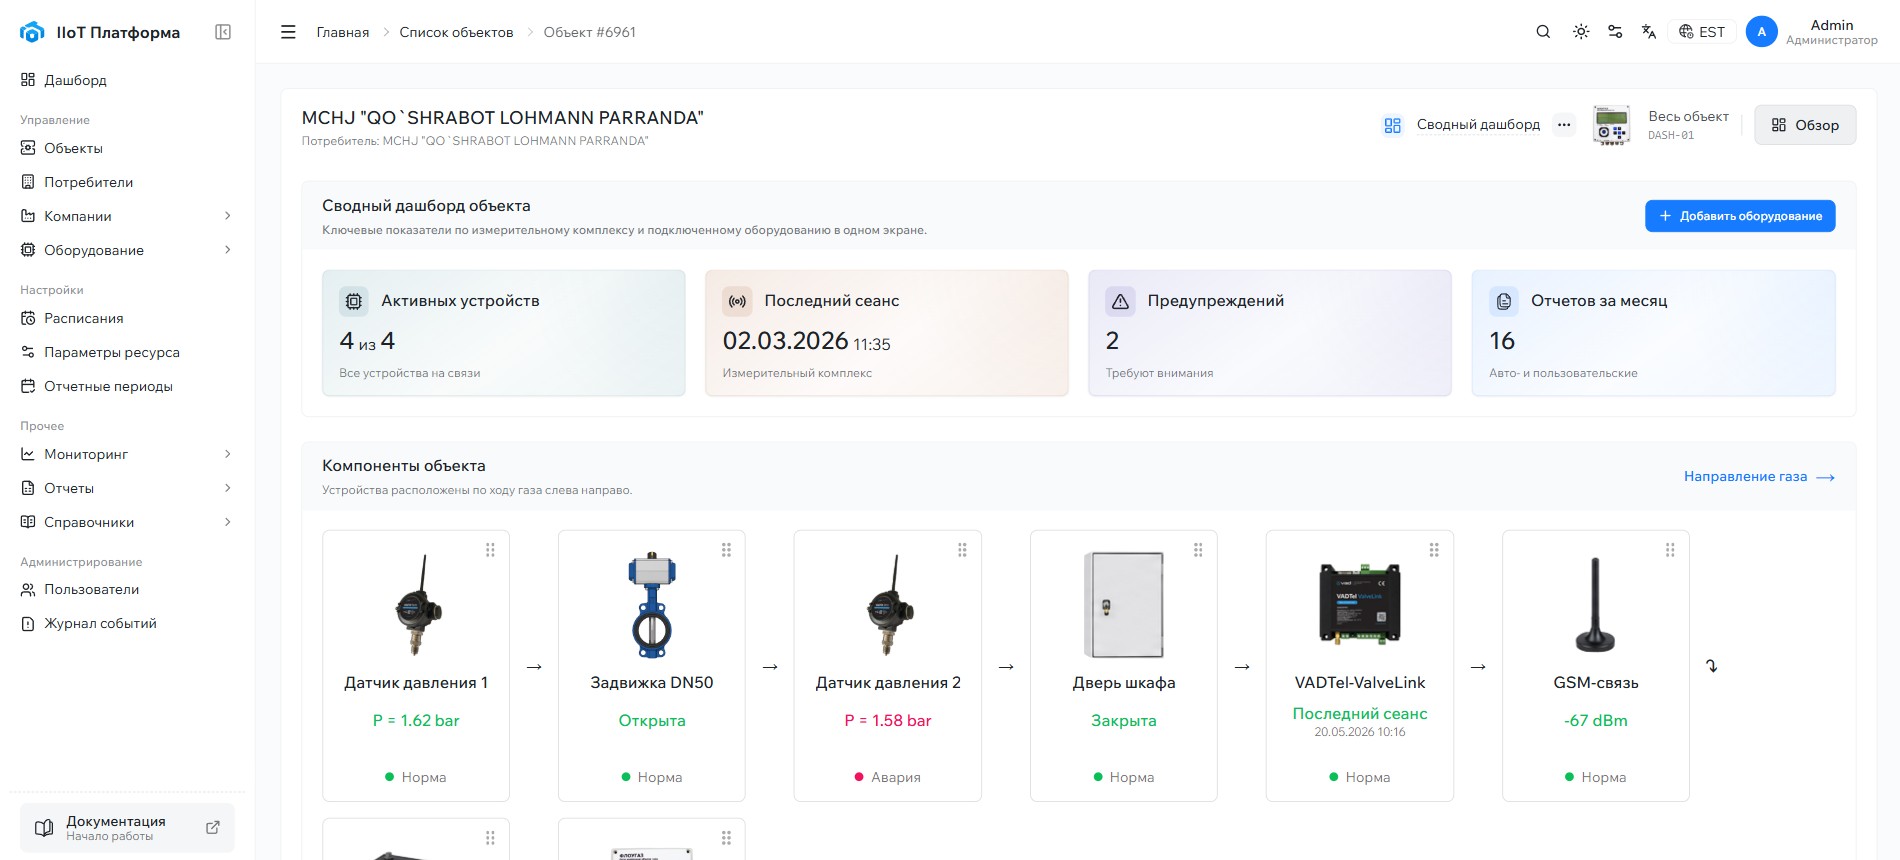
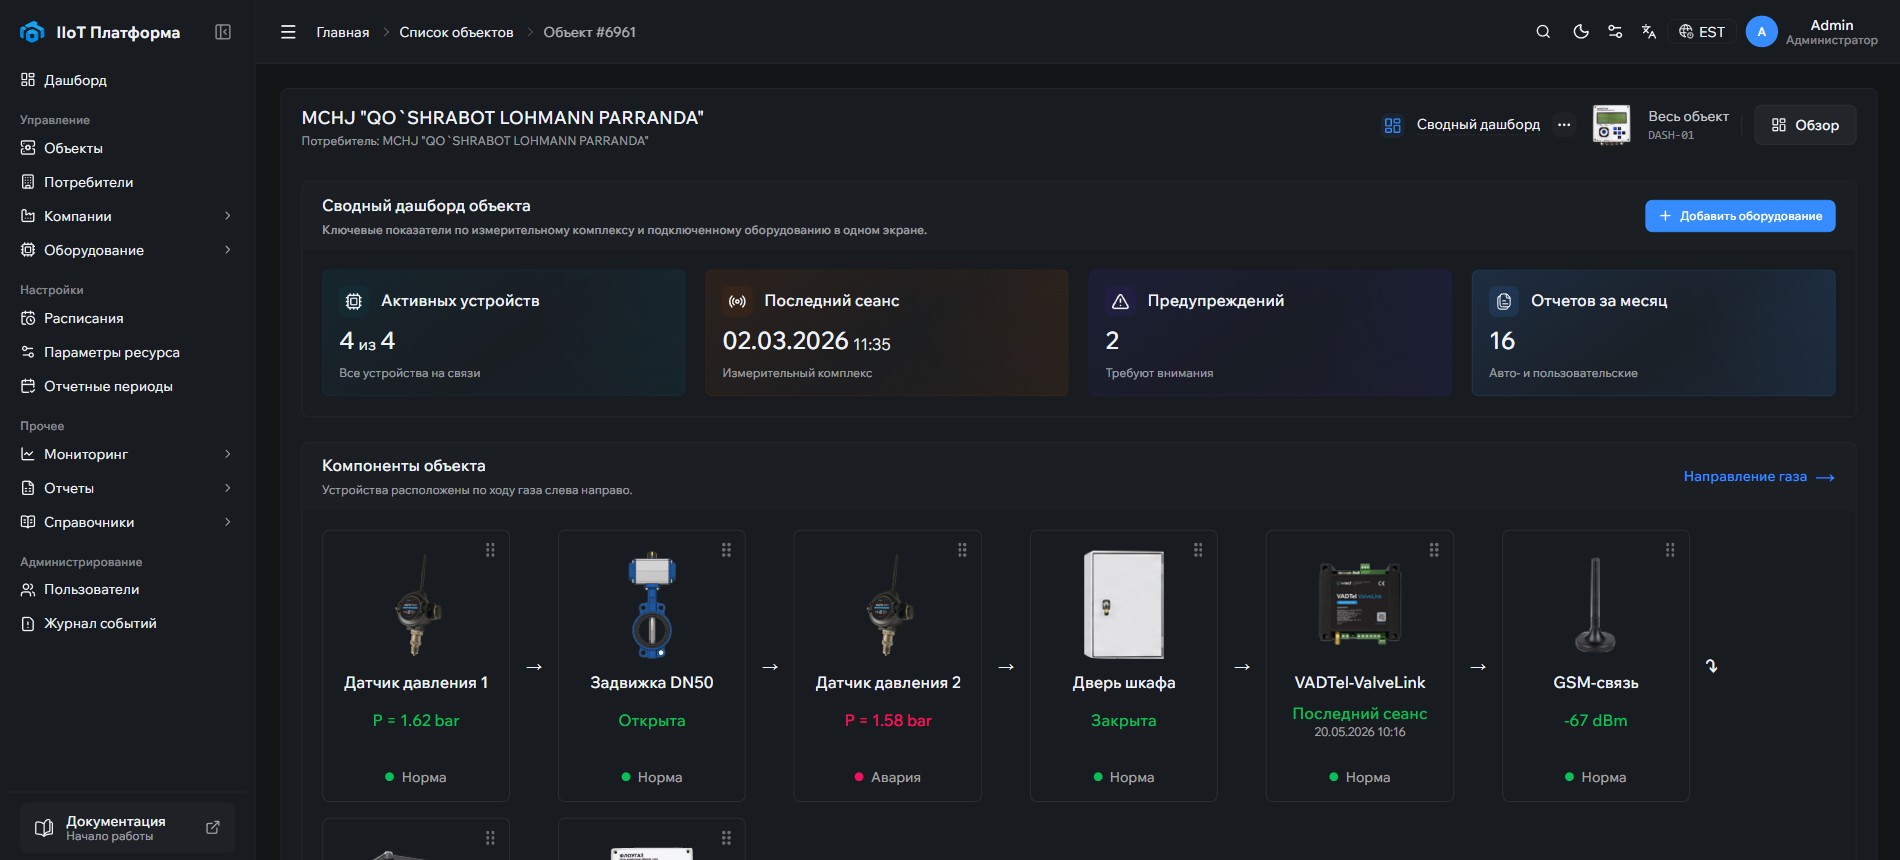
A single device fleet for the ecosystem: correctors, meters, pressure sensors, detectors and shut-off devices in one registry — with types, connection schemes and preinstalled drivers.
Built for industrial operation
From meter polling to a verified resolution — every function answers a real scenario in the work of a dispatcher and a metrologist.
Telemetry collection
Automatic scheduled polling, manual and unplanned communication sessions
Single equipment fleet
Correctors, meters, pressure sensors and shut-off devices in one registry
Alarm events
Connection losses, abnormal modes and pressure thresholds — with instant notifications
Site map
Geolocated metering points with statuses and a quick jump to the site
Archives and reports
Hourly and daily archives, reporting periods and data export
Remote control
Commands to shut-off devices with execution confirmation
Roles and access
Permissions scoped by company, branch and department
Open integration
REST API and open contracts — your systems get the data
Runs on proven technologies









70+device types
Correctors, meters, sensors and detectors from different manufacturers — in one data model.
200+equipment drivers
Preinstalled in the platform: connecting a new device requires no development.
Connect. Monitor. Control.
The ecosystem is deployed in your own perimeter or in the cloud. Start with a pilot area — we will connect the first metering points within days.
Still have questions?
Didn’t find the answer — write to us. We will help with a pilot project, device connection and integration.
Contact usGas volume correctors (EK-270, Flowgas, ULTRAMAG and others), pressure sensors, detectors and shut-off devices. The supported equipment fleet keeps growing.
Telemetry over GSM and NB-IoT: scheduled polling, manual and unplanned sessions. Data is validated and reaches the archives within minutes after a session.
Yes: REST API, MQTT and exports for SCADA and accounting systems. Open data formats — no vendor lock-in.
The Operational Health Matrix module: it turns telemetry signals into manageable operational tasks — with owners, SLAs and data-driven verification of the resolution.Read more in the documentation
Roles and permissions are assigned by company, branch and department: each user sees only their own sites and the actions available to them.
The full guide — configuration, working scenarios and the API — is atdocs.vadsro.eu
Nine connected industrial IoT subsystems on a shared core: telemetry collection and analytics, SCADA dispatching, operational tasks, document workflow and a fault-tolerant cluster. One data model, one access perimeter. Built by V.A.D. s.r.o.
IIoT Platform
© 2026 V.A.D. s.r.o. All rights reserved.
Version 3.0IIOT ECOSYSTEM